We paid to print twenty thousand lines about ourselves
What a starter tier does to a codebase, and what per-line log billing does to debugging
Two things about running a worker on a platform’s cheapest tier that nobody puts in the getting-started guide.
The tier writes your architecture
Our 2025 feed importer ran on Render’s starter plan: 512 megabytes. That is a fine amount of memory for a web service that answers requests and forgets them. It is a hostile amount for a process whose whole job is to move twenty thousand rows through itself.
So we did not write an importer. We wrote a distributed system: a Redis-backed queue, jobs capped at five hundred items, a worker with adaptive concurrency, a memory manager, error recovery, and a monitoring package with its own README. Every piece of that exists because the process could not hold the catalogue.
None of it is over-engineering in the usual sense. Each part is the correct local response to the constraint. It is just that the constraint was a line item, and we answered it with three months of engineering instead of with a bigger instance. Nobody ever ran that comparison, because the cost of the tier is a number on an invoice and the cost of the architecture is not a number anywhere.
The platform also did not tell us how much memory the process had. The code walks through a series of detection attempts and lands on:
return 512 // Default Render Starter tierA hardcoded guess about somebody else’s product, in our source, as the base case. In production we ended up setting TOTAL_MEMORY_MB by hand, which is the same guess with fewer steps.
Then it bills you for finding out
The importer logs one line per product. Not per batch, per product:
🔄 Updating existing product: ...
➕ Creating new product: ...
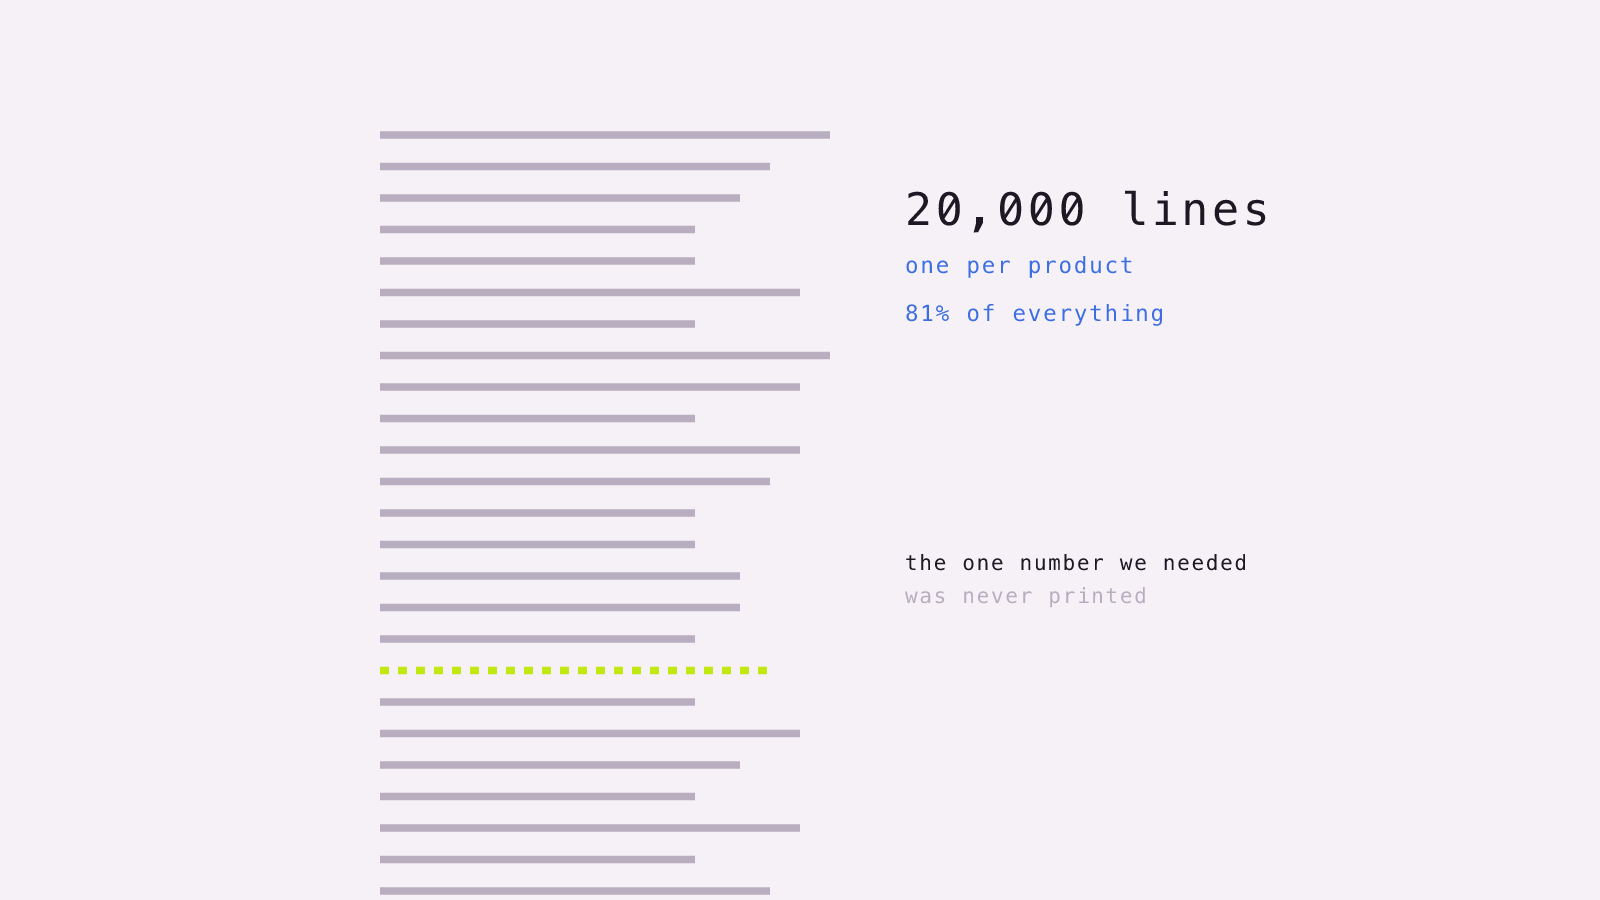
Twenty thousand of those per run, out of roughly twenty-five thousand lines total. 81% of everything the system said about itself was one line per row, saying that a row had happened.
That is what debugging looks like when you cannot attach to the process. No debugger, no heap snapshot, no stepping — a log stream and a redeploy, which is a four-minute round trip. So you print. And the commit log has the shape of it: fix: add more logs, then fix: remove redundant logs, two commits apart.
Logs are metered. So the debugging strategy the platform pushes you toward is the one it charges for. That is not a conspiracy, it is just the incentive lying on the floor where anyone can trip over it.
The joke is that the log did not even carry the information we needed. skippedCount — the counter that would have shown we were re-parsing 410,000 rows to import 20,000 — was incremented on every discarded row and printed nowhere. Twenty thousand lines of output, and the one number that mattered was not in any of them.
Coda
All five services in that project now read Suspended by Render, eight months ago. The database, ElasticSearch, Strapi, the worker, the cron. The last commit was two months before that.
It did not fall over. It ran, then the platform turned it off, and that was that.
Written up properly in the post-mortem.