We shipped 20,000 products and downloaded the feed forty-one times
A feed importer built around the wrong constraint. Eleven places where the fix landed next to the problem instead of on it
In the autumn of 2025 we built a product feed importer. A BullMQ queue, a worker with adaptive concurrency, a memory manager, error recovery, 2,400 lines of monitoring. It worked. It moved the catalogue. Almost every part of it is the shape that 512 megabytes of Render's starter tier pressed into the code.
The constraint was real and the response was rational. We were just measuring the wrong resource. We spent three months defending against memory, and paid for network, re-parsing, and — as it turns out — correctness.
A year later we opened the repository and read it like someone else’s. What follows is eleven places where the fix landed next to the problem instead of on it. Nothing here is reconstructed: every line is still in the file, every commit is still in the log.
I. The machine
The job is unglamorous. A merchant publishes a feed — CSV or YML, twenty thousand offers, a URL that returns the whole thing in one response. We fetch it, parse it, normalise it, write it to Postgres through Strapi, and mirror it into ElasticSearch so the search endpoint has something to answer with. Then we do it again tomorrow, because prices move.
At the scale of one feed on a laptop this is a script. node importFeed.js, wait, done. That is genuinely where it started, and the roadmap in the repo still walks a junior through exactly that first step.
What turns it into a system is the environment. The worker ran on Render’s starter tier: 512 megabytes. A twenty-thousand-row feed does not fit in 512 megabytes if you hold it whole, and Node will happily try. So the shape of the answer was decided before the first line of the importer was written: nothing may be held whole. Stream the response, parse incrementally, write in batches, never materialise the full catalogue.
From that single constraint, everything else follows, and each step is defensible on its own.
If nothing is held whole, work has to be split — so the import becomes jobs, capped at 500 items each. If work is split across jobs, something has to schedule them — so BullMQ and Redis. If jobs run concurrently, something has to stop them running too concurrently — so a batch size, a parallelism limit, a concurrency limit. If the ceiling is memory, something should watch memory — so a memory manager with warning and critical thresholds. If a job dies halfway through twenty thousand products, something has to resume rather than restart — so an offset, carried between jobs. If any of this fails at three in the morning, something has to say so — so health checks on Redis, resource sampling, job duration tracking, queue depth.
None of those decisions is wrong. Read one at a time, each is what you would do. The result is a genuinely capable pipeline: a parser factory for CSV and YML, a saver with retry and backoff, an ElasticSearch sync, adaptive tuning that widens batches when memory is comfortable and narrows them when it is not, and a monitoring package large enough to have its own README.
And it ran. That part matters and we are not going to be coy about it — the catalogue got imported, search worked, the site had products in it. This is not a story about something that failed loudly.
It is a story about what we were defending. Every one of those mechanisms guards memory. Not one of them measures what a run costs in bandwidth, in re-parsed rows, or in redundant writes — and none of them checks whether the run did the thing it exists to do.
The three knobs, written down in three places by the same team:
| items/job | batch | parallel | concurrency | |
|---|---|---|---|---|
DEPLOYMENT.md — the plan |
— | 500 | 3 | 15 |
constants.ts — the code |
500 | 40 | 3 | 4 |
| Render dashboard — production | 500 | 40 | 3 | 4 |
.env.example — the file you’d copy |
15,000 | 50 | 1 | 1 |
The plan wanted fifteen parallel workers and batches of five hundred. The code assumed four and forty. Production, it turns out, ran exactly what the code already defaulted to — every one of those six variables was re-entered by hand into the dashboard at the value it already had.
The odd row is the last one. .env.example matches nothing: not the plan, not the code, not production. It is also the only one of the four a new developer would ever open. Its MAX_ITEMS_PER_JOB is thirty times production’s, which would change the entire shape of a run.
Next to the plan, in the same DEPLOYMENT.md, a promise: Bulk imports: Hours → Minutes, 10-50x faster. That refers to a bulk path that was enabled, reverted twice in a single day, and never appeared in the shipped bundle at all.
One more thing about that table, which we only learned while writing this post. The six knobs that decide how the importer behaves live in a dashboard. Not in the repository, not in .env.example, not in the deployment doc — in a web form, outside version control, with no history and no review. We had to go and look them up to find out what our own system had been doing. They happened to match the defaults. Nothing in the codebase would have told us if they hadn’t.
Here is what the machine actually did.
II. Eleven scars
1. The offset rescan
The pipeline resumes by offset. Job k starts at row 500k. The parser honours that by downloading the entire feed again and counting past the rows it already handled:
if (processedCount < startOffset) {
  skippedCount++
  processedCount++
  continue
}
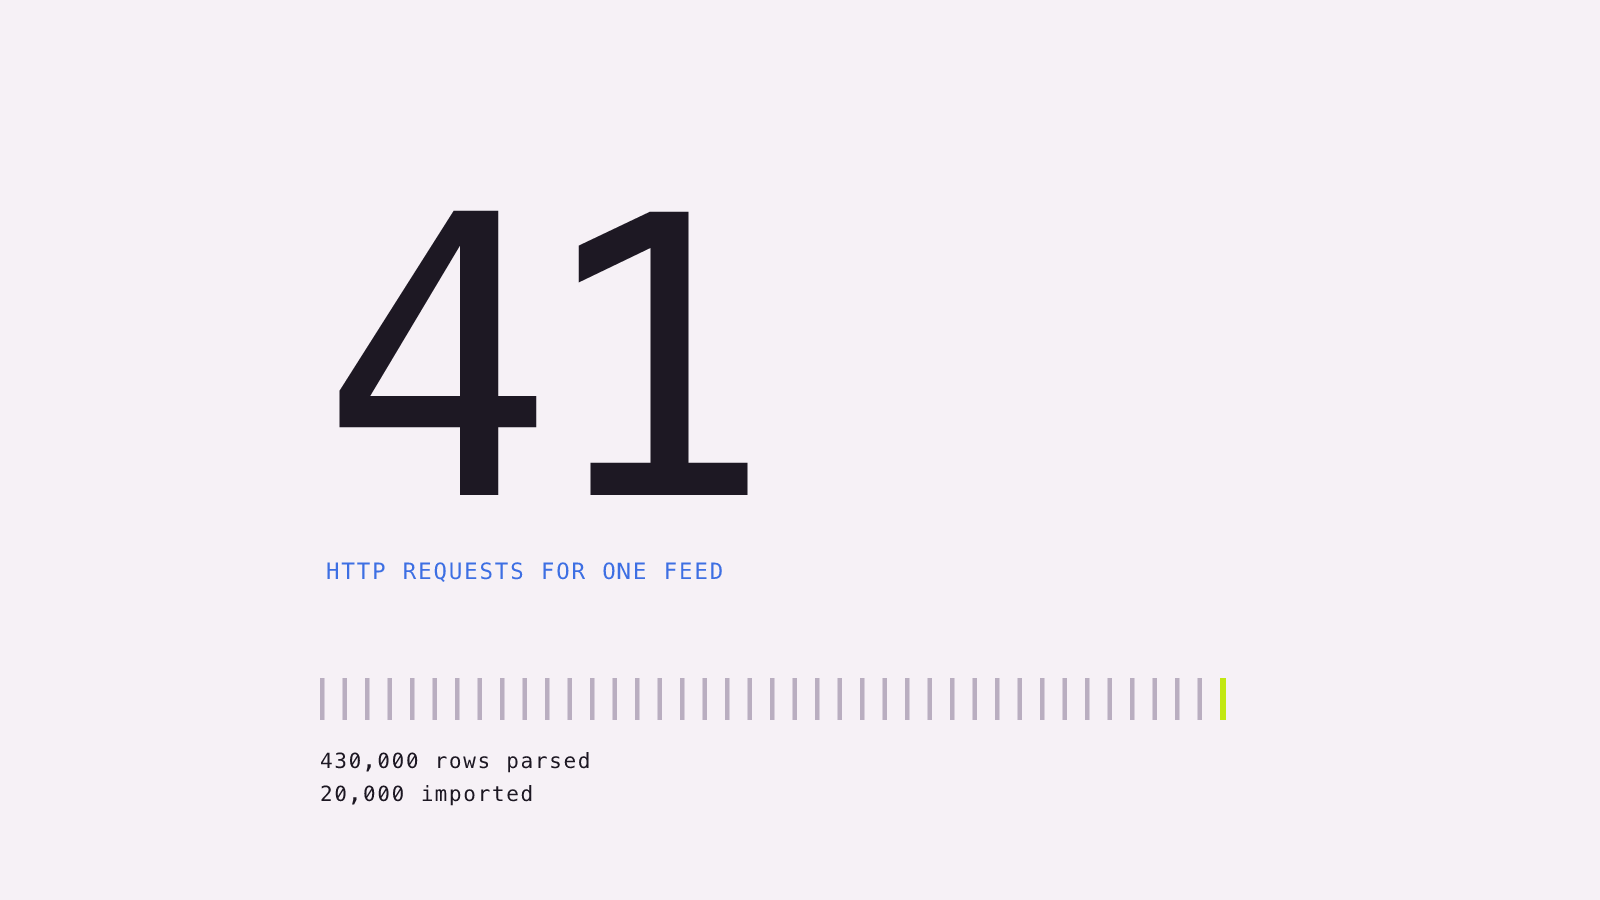
At MAX_ITEMS_PER_JOB: 500, a twenty-thousand-item feed takes 41 jobs. Job k reads 500(k+1) rows to collect 500 of them. Summed:
| Jobs | 41 |
| HTTP requests for the feed | 41 |
| Rows parsed | 430,000 |
| Rows discarded by offset | 410,000 |
| Useful rows | 20,000 |
21.5 rows parsed per row imported. In closed form, for a feed of N items at M per job: rows read is N(N + 3M) / 2M, which grows quadratically. Doubling the feed roughly quadruples the parsing.
The forty-first job is the detail worth sitting with. It downloads the whole feed, skips all twenty thousand rows, collects nothing, and returns — its entire purpose is to discover that the feed has ended. There is no cheaper way to learn that, because nothing in the pipeline records how long the feed was last time.
skippedCount is declared, incremented on every discarded row, and printed nowhere. The number that would have made this visible was being computed the whole time.
2. The bug fixed one floor up
In the same parser:
const hasMore = processedCount > startOffset + items.lengthThe break on the item limit fires before the final increment, so when a job fills exactly to its cap, the comparison is an equality and hasMore comes back false. The parser reports “no more data” precisely when there is the most of it left.
Somebody found this. They fixed it in the caller:
const reachedJobLimit = itemsProcessedInThisJob >= maxItems
const hasMoreData = hasMore || reachedJobLimit
An || in the processor, papering over an off-by-one in the parser. The bug is still there. So is the compensation, one file away, and neither knows about the other. If you ever fix the parser, nothing breaks — which is exactly why nobody ever will.
3. The YML parser is worse, and loses data quietly
The CSV parser at least stops reading. The YML one does not: its break on maxItems exits the inner offer loop, not the outer for await over the stream. Every YML job reads the feed to the end, whether it needs to or not.
| CSV | YML | |
|---|---|---|
| Rows read, N=20k | 430,000 | 820,000 |
| Ratio to useful | 21.5× | 41× |
Then there is this:
const MAX_BUFFER_SIZE = 512 * 1024 // 512KB buffer limit

if (buffer.length > MAX_BUFFER_SIZE) {
  // Buffer too large, truncating silently
  const lastOfferStart = buffer.lastIndexOf('<offer')
  buffer = lastOfferStart > 0
    ? buffer.substring(lastOfferStart)
    : buffer.substring(buffer.length - 50000)
}
A hand-rolled search for <offer in a string, in a project that already has fast-xml-parser in its dependencies. And when the buffer overflows, everything between the last processed offer and the last <offer marker is dropped. The comment says so.
This is not an edge case. Once a job hits maxItems, the break skips the line that trims the buffer, so the buffer grows by one chunk per iteration for the entire remainder of the feed, overflowing and truncating again and again. In the fallback branch — taken whenever <offer is not found in the retained window — the minimum loss is 474,288 characters per occurrence.
There is no counter and no log. The only record that any of this happened is the word silently in a comment.
And 512 kilobytes, chosen for the same reason as everything else: an echo of 512 megabytes, one floor down.
4. The safe chunk that never chunks
// 🔑 split api-batch further into safe-chunks to avoid Strapi overload
const safeChunks = chunkArray(apiBatch, WORKER_CONFIG.SAFE_CHUNK_SIZE || 50)
apiBatch has already been cut to DEFAULT_BATCH_SIZE = 40. SAFE_CHUNK_SIZE is 200. Slicing forty items into chunks of two hundred yields exactly one chunk, every time.
The key emoji is the part that gets me. Somebody marked this as the important line.
And it can never start working: the performance optimiser clamps batch size to 20–80 and safe chunk size to 100–400. The floor of the chunk is above the ceiling of the batch, by construction. The adaptive tuner guarantees the safety mechanism stays off.
5. Memory: three truths and a lever that may not be there
The thresholds live in constants.ts — warning at 80%, critical at 90%. The memory manager uses 0.7 and 0.85, hardcoded, and never reads the constants at all.
In production, MEMORY_WARNING_THRESHOLD_PERCENT and MEMORY_CRITICAL_THRESHOLD_PERCENT are both set. The correct keys, the ones the env mapping expects, entered deliberately by someone tuning a live system. The memory manager ignores them too. Meanwhile .env.example offers MEMORY_WARNING_THRESHOLD_MB and MEMORY_CRITICAL_THRESHOLD_MB, which map to no key at all and are read by nothing.
So: two dials on the dashboard, wired to nothing. Two more in the example config, wired to nothing, with different names. And two hardcoded numbers doing the actual work. There is a commit — fix: use real available memory in system, bumb warning limits — from someone turning the first pair and watching nothing happen.
Memory detection is a ladder of guesses ending in return 512 // Default Render Starter tier. It did not work either: production sets TOTAL_MEMORY_MB by hand. That variable is also how we know the tier was real, and not just what the fallback assumed.
Then, in the cleanup path, this:
if (global.gc) { global.gc() }--expose-gc does not appear anywhere in the repository — not in package.json, not in the Dockerfile (which turns out to be an ElasticSearch image, unrelated to the worker), not in .env. The remaining possibility was NODE_OPTIONS in the dashboard. There is no such variable there.
So global.gc is undefined and if (global.gc) no-ops in silence, on every pass, forever. Three commits about memory leaks landed on 30 September. The main lever in the file was never attached, and nothing in the code, the logs or the platform would have said so.
Directly above it, performCleanup() clears require.cache of every module whose path contains node_modules and does not contain core or elasticsearch. This returns almost no memory — the module objects survive in closures — and breaks singletons on the next require.
6. A dropped connection counts as success
isConnectionTerminatedError — matching UND_ERR_SOCKET and 'terminated' — appears in four places, and in all four a dropped connection is treated as a normal end of stream. There is a method called isConnectionTerminationSuccess().
Two commits: Fix AbortError in CSV parser causing false failures, then 🔧 Fix AbortError in CSV parser. The honest one is a comment:
// Abort the controller only on errors to clean up resources
controller.abort()
abort() used to be called unconditionally, killing the stream mid-read and raising the very AbortError the code then learned to interpret as success. Half a day lost to an AbortController we had pointed at ourselves.
The cost is that a genuine mid-run network failure is now indistinguishable from a completed feed. The import ends early, reports success, and the rest of the catalogue silently does not exist.
7. The map that holds a hundred, and the update that never happens
This is the one that matters.
Before writing a batch, the saver builds a map of products already in the database, so it can decide between create and update. It requests pages with pagination[limit]=500. The API config sets maxLimit: 100. The loop exits on:
if (items.length < pageSize) breakIf Strapi honours its own maxLimit, one hundred items come back, one hundred is less than five hundred, and the loop stops after a single request. The map of existing products holds 100 entries out of 20,000. If the limit passes through unclamped, a separate ceiling — maxItems = 10000 // Memory protection limit — caps it at half the catalogue. We could not settle which branch ran without the Strapi runtime, and we are not going to pretend otherwise. Both are bad; one is worse.
The map is also rebuilt from scratch on every call — 120 times per run — and never reused between slices.
What happens to a product that is not in the map:
existingMap.get(offer_id)returns undefined, so the code takes the create branchPOST /api/productsreturns 400, unique constraint onoffer_id- The error handler checks the map again, finds nothing again, and returns a fabricated success:
{ data: { id: "skipped" } } pRetrydoes not retry, because nothing was thrown- The update never runs. The product’s price is not written.
- The counter increments, and the run prints:
📋 Note: N products were skipped because they already exist in the database
   This is normal when processing large datasets or running parallel jobs
That note is not documentation. It is an explanation written by someone who saw the number and needed it to be fine. And the race it is explaining is real — MAX_PARALLEL_BATCHES: 3 times DEFAULT_CONCURRENCY: 4 gives up to twelve concurrent creates against a map that is updated locally and non-atomically — but the race is not why the number is large. The number is large because the map is nearly empty.
Then the success rate:
Math.round(((created + updated + skipped) / processed) * 100)skipped is in the numerator. A run in which nineteen thousand nine hundred products failed to update reports as a complete success, with a note explaining that this is normal.
Twenty thousand individual HTTP requests, one per product, no batching at the transport layer. The importer exists because prices move. For most of the catalogue, most of the time, they moved and we did not write them down.
8. The optimisation that was never wired in
calculateProductHash() // md5 over offer_id|name|price|old_price|currency|url|image|brand|modelAn md5 of the fields that matter, so unchanged rows can be skipped. Between two runs of a marketplace feed, maybe five per cent of rows change. This one function is worth more than every batch size, concurrency limit and adaptive tuner in the codebase combined.
It is defined in the saver and called zero times. Its only live call site is in bulk-db-operations.ts, which is itself dead: 470 lines referenced only by a filename in a build script list.
We checked this properly rather than by grep. No barrel files, no export *; all fifteen dynamic imports in the repository resolve to p-retry, p-limit, an entity and a database connection. And the shipped bundle, built the same day as the final commit, contains the string calculateProductHash zero times. It is not unused code. It never reached production at all.
Alongside it: strapi-feed-saver.ts, 407 lines, imported solely for a type. fetchAllExistingMapLegacy, kept “for comparison” — and, incidentally, free of the pagination bug in scar 7, because it paginates on meta.pagination.pageCount instead of comparing against page size. Roughly nine hundred lines of abandoned alternatives, containing both the idea that would have solved the problem and the code that did not have the bug.
9. Two reverts in one day
09-23  🚀 Enable optimized feed processing
09-24  🔧 Fix memory issues in optimized feed processing
09-24  🚨 HOTFIX: Revert to stable feed processing
09-24  🔧 Hotfix: Revert to stable feed processing
09-24  🚀 Fix ES modules and enable optimized worker
Enabled, out of memory, reverted, reverted again — the second one is what panic looks like in a commit log — then re-enabled through a module-format change. bulk-db-operations.ts has been a corpse since that day, and so has the only real optimisation in it.
10. The fix that spawned three code paths
const jobId = `${baseJobId}:${timestamp}`Commit: fix: add timestamps to job id to make them unique. Adding Date.now() made every job id unique, which killed BullMQ’s native deduplication — the only reason to construct job ids that way in the first place.
So deduplication had to be rewritten by hand: a scan of the first fifty jobs, best-effort, proceeding with creation on any error, with a backpressure check on top that skips when more than twenty jobs are waiting.
Follow-up jobs are now created down three independent paths — from the processor, from a retry wrapper commented leaving to cron watchdog, and from a thirty-second sweep labelled (safety-net). The safety net uses await job.remove() as a mutex: it deletes the finished job so that nobody else creates a duplicate follow-up.
11. The last commit is a typo in a queue name
13 October 2025, final commit in the repository:
fix: align all queue names to 'worker-jobs' - fixes worker not processing jobsThe same comment — Fixed: align with worker.ts queue name — now appears in four files. The worker had been doing nothing. No error, no crash, no alert: it was subscribed to a queue nobody wrote to. The monitoring package watches Redis health, resource use, job duration and queue depth, and none of those fire when the depth of the queue you are watching is correctly zero.
The residue is in queue.add('worker-jobs', {...}), where the job name was set equal to the queue name, just in case.
Minor keys
The BOM won twice. Despite bom: true in the parser config, the saver contains the literal bytes ef bb bf inside a string key, plus a third fallback that takes the first key containing id — a mine of its own.
Two merchant feed IDs are hardcoded into parser selection, so the choice of parser depends on a list of specific clients. Not one accident: two, systematically.
Availability is item.available === "true" || item.available === "1". Any feed using yes, Y or a Russian word puts the whole catalogue out of stock, quietly.
ElasticSearch indexes raw feed items, not validated products, so the index contains a different id field than the database and includes rows that failed validation. The index and the database diverge by design.
Eight constants in a row carry the comments Increased for better stability and Increased for better performance. Everything was turned at once, so nothing is known about which of it helped.
Three timeout values in .env.example have trailing commas, which Number() turns into NaN.
And, on 29 September: fix: remove ai shit.
What was tested
Nothing. No test script, no runner in the dependencies, no config, no CI. Four files with test in the name print timings and assert nothing about behaviour.
Zero of the eleven scars above is covered by anything. Every one was found by reading, a year later, with no deadline.
III. What would have removed almost all of it
Two changes.
Read the feed once. A cursor instead of an offset: keep the stream open across the batch boundary, or write the parsed rows somewhere cheap and page through that. 41 downloads become 1. 430,000 parsed rows become 20,000. The quadratic term disappears, and with it the reason the job cap existed.
Wire up the hash. It was already written. Compare the md5 of the nine fields that matter, skip the rows that have not changed. On a marketplace feed that is roughly a twenty-to-one reduction in writes — 20,000 requests to Strapi become about a thousand.
Together: one download instead of forty-one, twenty thousand parsed rows instead of four hundred and thirty thousand, a thousand writes instead of twenty thousand, and around twenty thousand fewer log lines — because 81% of the log volume was one line per product, printed to a platform that bills for logs.
None of that requires a queue, a worker, adaptive concurrency, a memory manager, or 2,400 lines of monitoring. The pipeline could have been a script that runs for four minutes.
And the correctness problem — the map that holds a hundred entries, the fake skipped, the update that never happens — disappears as a side effect. With a single pass and a content hash, there is no per-slice map to rebuild, no race between twelve concurrent creates, and no need for a success metric that counts failures as successes to look healthy.
What we take from it
The constraint was real. 512 megabytes is 512 megabytes, and every mechanism we built is a correct response to running out of memory. The failure was never in the engineering; it was in never asking a second question after the first one had an answer.
We asked how do we not run out of RAM and answered it well. We never asked how much work is this doing, and the answer was: twenty-one times too much. We never asked is it doing the right work, and the answer was: for most of the catalogue, no.
The tell was there the whole time. A counter that was incremented and never printed. A success rate with failures in the numerator. A note in the output explaining that a large number was normal. Every one of those is the system trying to say something, written by us, in a voice we had already decided not to hear.
And the last one only surfaced while this post was being written: we could not say what our own importer was configured to do without logging into a dashboard. Six numbers that determine everything above, held in a web form, with no history, no review, and no copy in the repository. They matched the defaults. We had no way of knowing that until we looked.