Five hundred and twelve megabytes
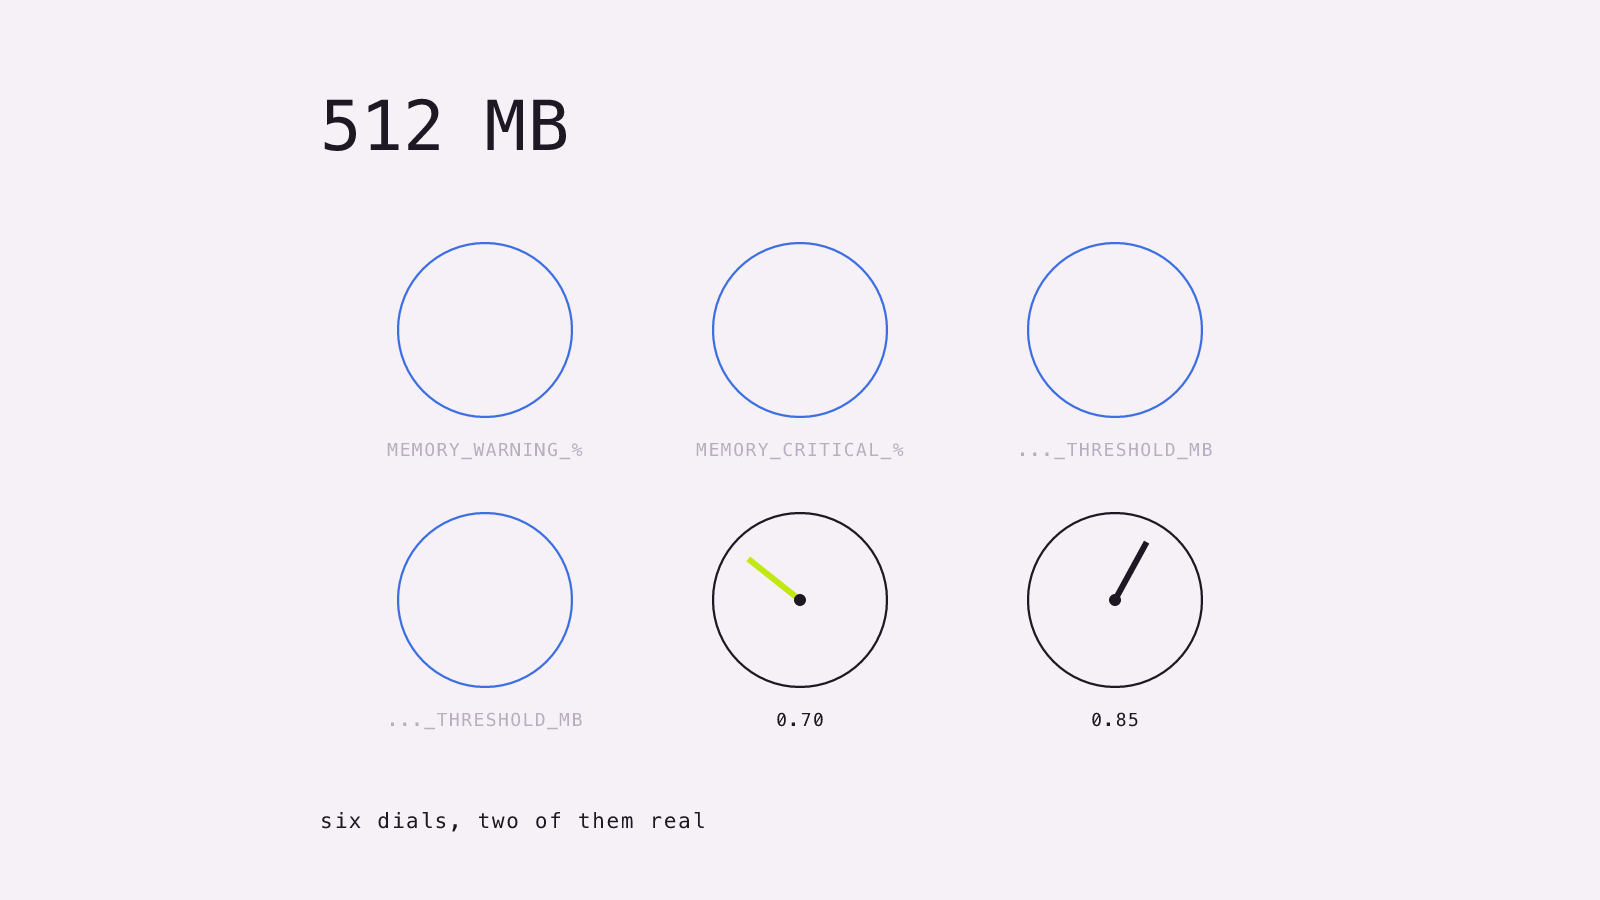
Six memory dials, four of them wired to nothing, and a garbage collector that was never turned on
Every architectural decision in our 2025 feed importer descends from one number: the worker ran on Render’s starter tier, 512 megabytes. A twenty-thousand-row catalogue does not fit in that if you hold it whole, and Node’s default heap will try. So nothing could be held whole — and from that single rule came the job splitting, the queue, the batch sizes, the concurrency limits, and a memory manager to watch it all.
The memory manager is where it gets interesting.
Six dials, two of them real
The thresholds are declared in constants.ts: warning at 80%, critical at 90%. The manager itself uses different numbers:
const warningThreshold = 0.7
const criticalThreshold = 0.85
Hardcoded. It never reads the constants.
In production, MEMORY_WARNING_THRESHOLD_PERCENT and MEMORY_CRITICAL_THRESHOLD_PERCENT are both set in the dashboard. Correct key names, the ones the env mapping expects, entered by hand by someone tuning a live system. Also ignored.
And .env.example — the file a new developer would copy — offers MEMORY_WARNING_THRESHOLD_MB and MEMORY_CRITICAL_THRESHOLD_MB, which correspond to no key anywhere and are read by nothing at all.
Six dials. Four wired to nothing, and the two that work are not dials, they are literals. There is a commit, fix: use real available memory in system, bumb warning limits, from someone turning the first pair and watching nothing change.
The detection ladder
How much memory does the process have? The code tries a series of guesses and ends here:
return 512 // Default Render Starter tierThat fallback is the last rung of a ladder, which means the rungs above it did not hold. Confirmed by production, which sets TOTAL_MEMORY_MB explicitly. Somebody watched the autodetection fail and typed the number in by hand.
The collector that was never attached
At the bottom of the cleanup path:
if (global.gc) { global.gc() }global.gc only exists when Node is started with --expose-gc. That flag is not in package.json. It is not in the Dockerfile — which turns out to be an ElasticSearch image, unrelated to this process. It is not in .env, and there is no NODE_OPTIONS variable in the deployed environment.
So global.gc is undefined, the branch never runs, and nothing anywhere says so. Three commits about memory landed on a single day in September. The lever they were pulling on was not connected.
Even if it had been: forcing a collection from inside the loop that is allocating is treating a symptom. V8 collects when it needs to. A manual gc() mostly buys a pause.
What it actually does instead
Directly above that line:
Object.keys(require.cache).forEach(key => {
  if (key.includes('node_modules') && !key.includes('core') && !key.includes('elasticsearch')) {
    delete require.cache[key]
  }
})
Clearing require.cache in production, in the hope of reclaiming memory. It reclaims almost none: the module objects are still referenced by every closure that imported them, so the cache entry goes and the memory stays. What it does accomplish is that the next require of any of those modules builds a fresh instance, which breaks every singleton it touches.
This is what running out of memory looks like from the inside at two in the morning. It is not stupidity. It is a person out of ideas, reaching for the biggest hammer in the room.
The part that stings
None of the above was the problem.
The importer re-downloaded the feed for every batch and re-parsed 430,000 rows to import 20,000. There was a content-hash function sitting in the same file, written and never called, that would have cut the writes by roughly twenty to one. Memory was never the binding constraint. It was just the only one we had built instruments for.
If you take one thing from this: a monitor is an argument about what matters. Build one for memory and every problem starts looking like memory. We had 2,400 lines watching RAM and not one line counting how many rows we had parsed to get one row in.
Full breakdown in the post-mortem.